
Investments
Overview
Under the direction of FPPA’s Board, our staff manages the assets in the Fire & Police Members' Benefit Investment Fund. The Board’s investment objectives, policies and guidelines are outlined in the Annual Financial Report. Investment staff and an outside consultant assist the Board in implementing its investment policies.
Investment Inquiries
Investment Managers may submit information to investmentsolicitations@fppaco.org
Fire & Police Members' Benefit Investment Fund
Includes the assets of the following plans:
- Statewide Retirement Plan: Defined Benefit Component
- Statewide Retirement Plan: Hybrid Defined Benefit Component
- Statewide Retirement Plan: Social Security Component
- Colorado Springs New Hire Pension Plan
- Statewide Death & Disability Plan
- Certain DROP (Deferred Retirement Option Plans) which are not self-directed
- Plus over 200 affiliated local "Old Hire" plans and Volunteer Fire pension plans
Fire & Police Members' Self-Directed Investment Fund
This fund includes the assets of the following plans:
- Statewide Retirement Plan: Money Purchase Component
- Statewide Money Purchase Plan
- FPPA 457 Deferred Compensation Plan
- Certain DROP (Deferred Retirement Option Plans) which are self-directed
The overall investment objective of the Fund is to prudently manage and balance the investment needs (risks and return) of all plans participating in the Fund, including the need to eliminate current unfunded liabilities and/or to protect surpluses. In developing long-term investment objectives, investment class allocations, and investment guidelines, we recognize that the Fund includes the assets of several different benefit plans, each with a distinct time horizon, risk tolerance, cash flow and liquidity needs, number of participants and benefit adjustment objectives. In consideration of these factors, effective July 1, 2019, plans are grouped into different investment pools:
| Pool Name | Description |
|---|---|
| Long-Term Pool | Designed primarily for open plans with a longer time horizon, higher risk tolerance, and lower liquidity needs. |
| Short-Term Pool | Designed primarily for closed plans with a shorter time horizon, lower risk tolerance, and higher liquidity needs. |
| Glide Path Pool | Designed for plans that need to transition over time from the Long-Term Pool to the Short-Term Pool. |
The Short-Term Pool and the Glide-Path Pool will have lower expected investment returns than the Long-Term Pool, which may affect required contributions for plans participating in these two pools. Please contact FPPA with questions regarding specific plan assignments.
As of March 31, 2026, The Fire & Police Members' Benefit Investment Fund totaled $8.163 billion.
| Pool Name | Fund Value |
|---|---|
| Long-Term Pool | $7.078 billion |
| Short-Term Pool | $32.771 million |
| Glide Path Pool | $1.052 billion |
The Board will conduct an asset/liability study as needed, but at a minimum every three years. The purpose of the study is to develop appropriate investment allocation targets and ranges which are generally expected to achieve the performance objectives relative to the liability and liquidity needs of the Pools and the overall risk tolerance of the Board. The Board relies upon analyses and recommendations from the Staff, Investment Consultant, FPPA’s actuary, and any other expert opinion that it determines is advisable. The Total Fund will be maintained as a single investment entity, with participation by the Pools to be achieved through accounting unitization.
Long-Term Pool Asset Allocation as of March 31, 2026

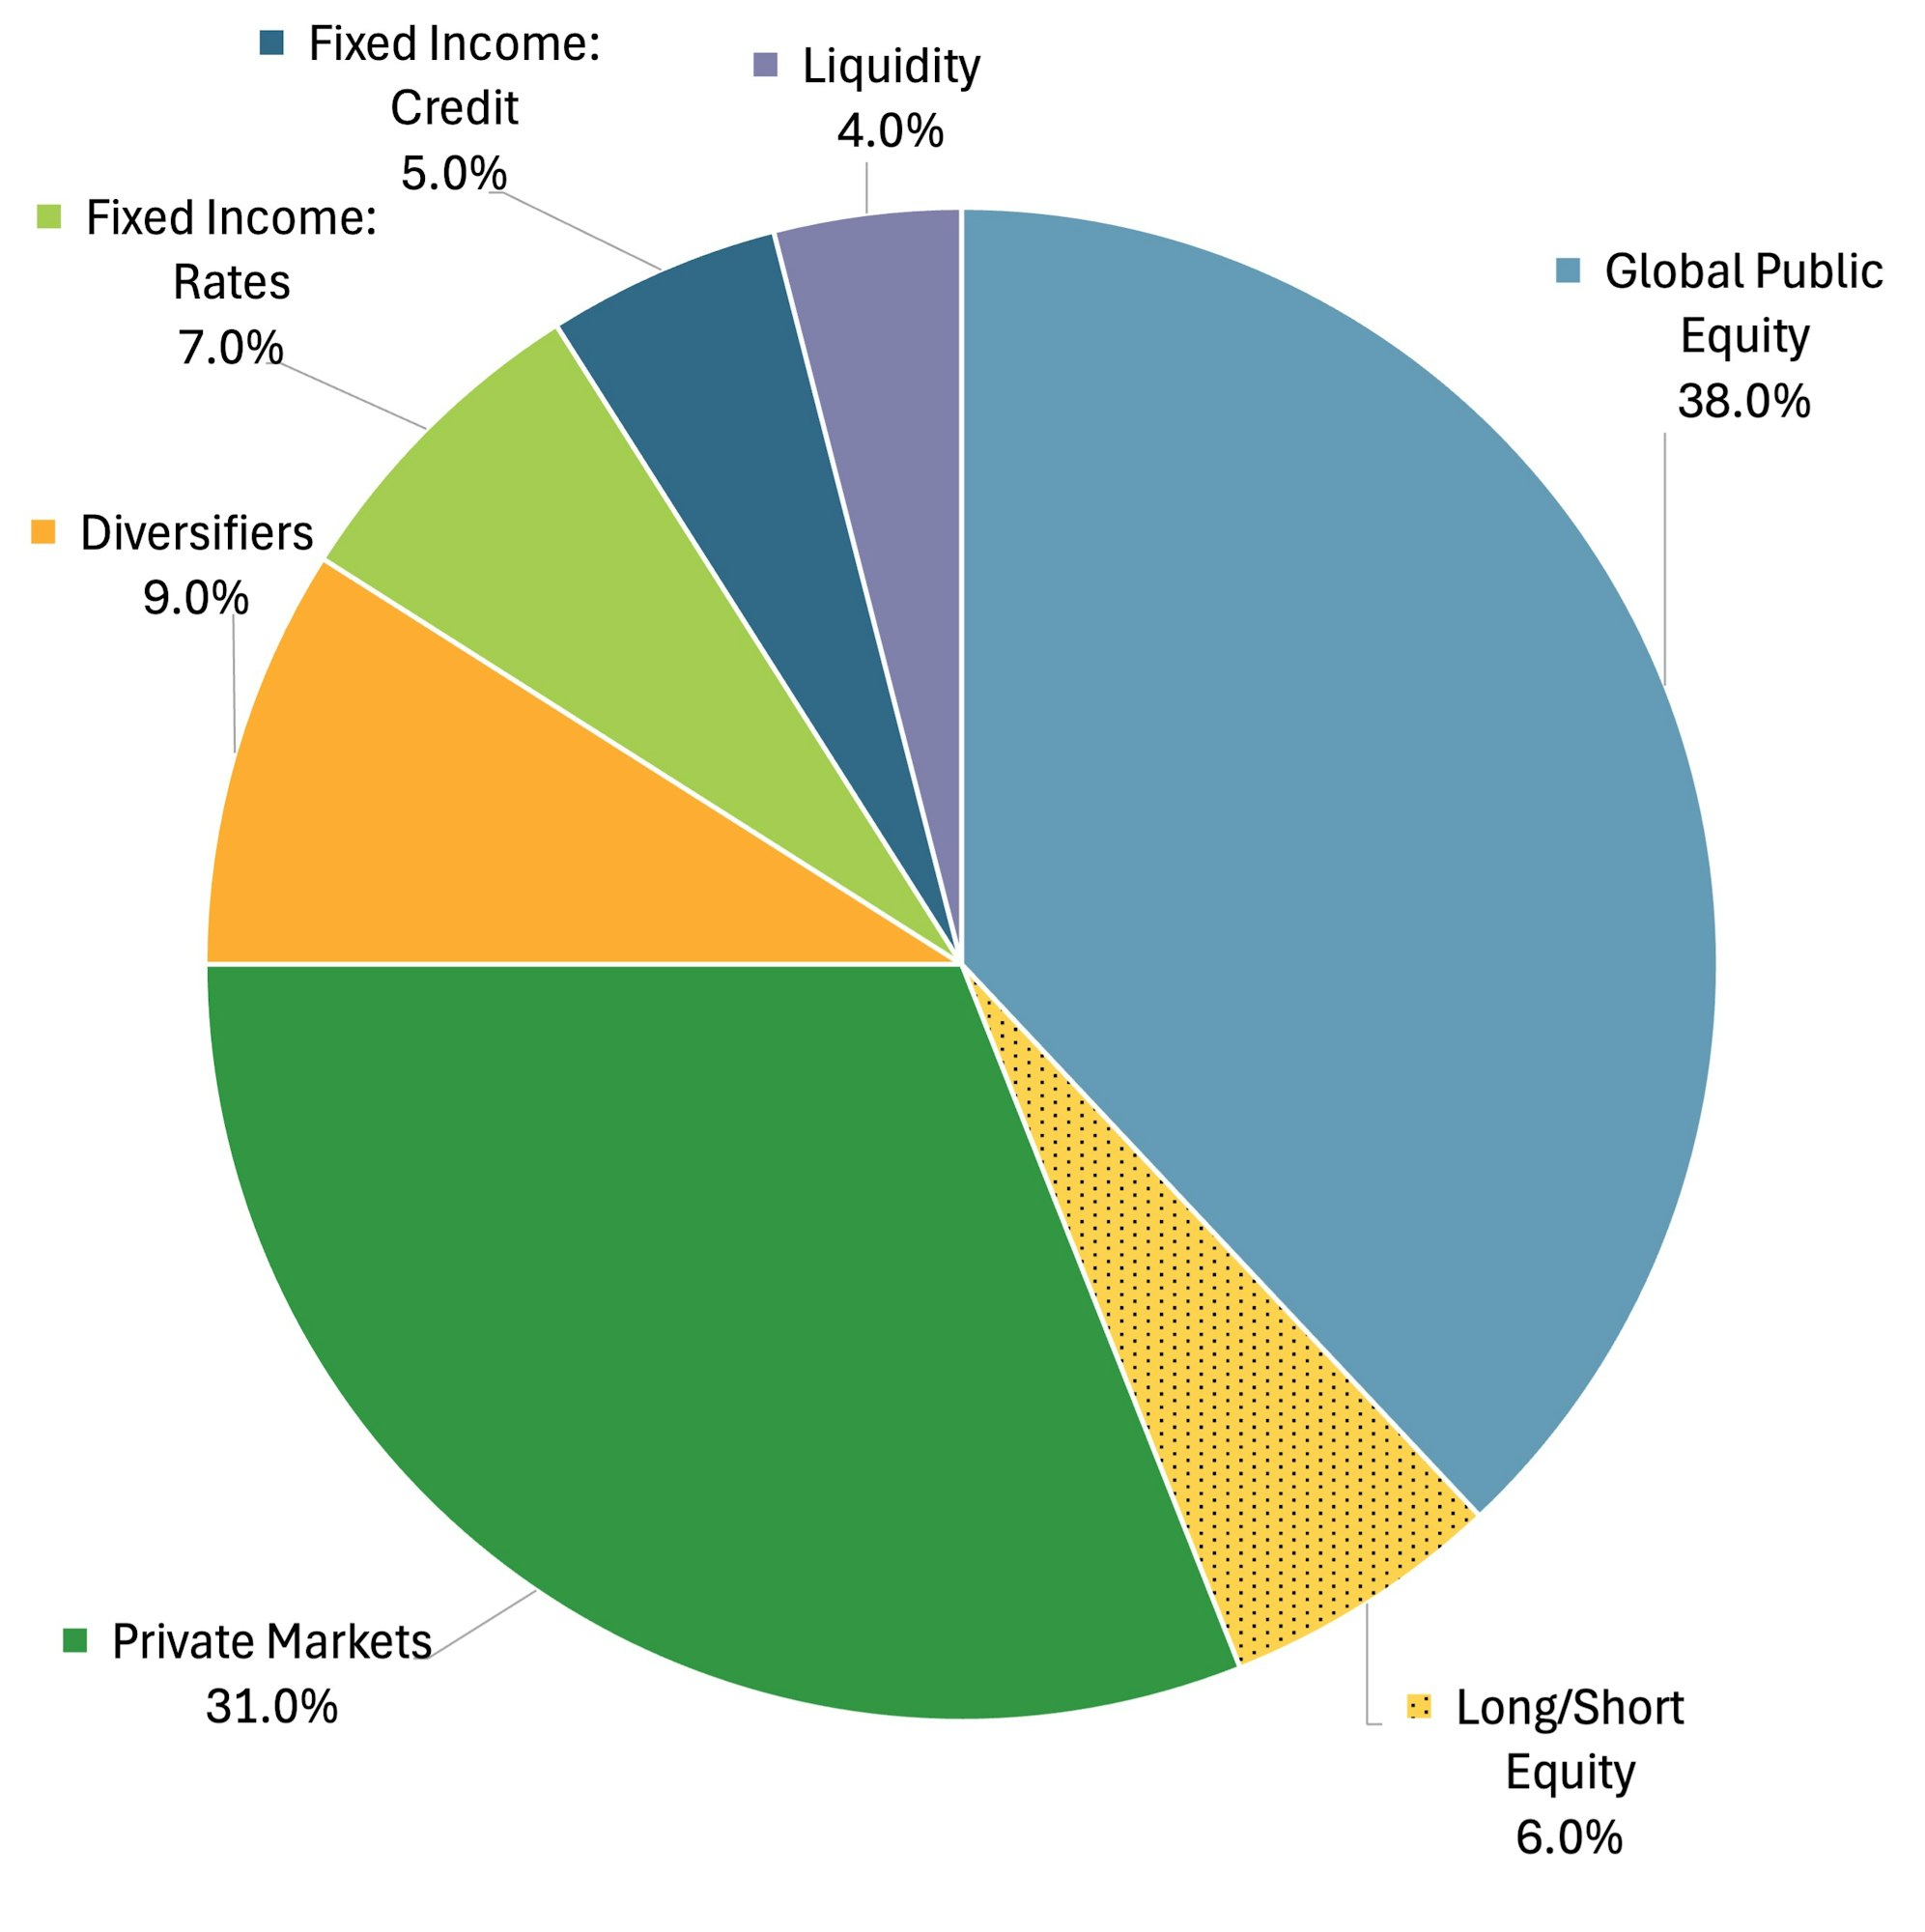
| Asset Class | Target Percentage | Actual Percentage |
|---|---|---|
| Global Public Equity | 38.0% | 37.8% |
| Long/Short Equity | 6.0% | 5.8% |
| Private Markets | 31.0% | 31.5% |
| Diversifiers | 9.0% | 8.1% |
| Fixed Income: Rates | 7.0% | 7.0% |
| Fixed Income: Credit | 5.0% | 5.5% |
| Liquidity | 4.0% | 4.3% |
Asset Class Definitions
| Class Name | Definition |
|---|---|
| Global Public Equity | Global • United States • International • Emerging Markets • Opportunistic |
| Long/Short Equity | Mid-Net Long/Short Equity • Activest • Event Driven |
| Private Markets | Private Equity • Private Debt • Real Assets • Real Estate |
| Diversifiers | Global Macro • Multi-Strategy • Low Beta Long/Short Equity • Alternative Beta • Opportunistic |
| Fixed Income: Rates | Core Fixed Income |
| Fixed Income: Credit | Multi-Sector • Structured • Opportunistic • Private |

| Year | Annual Return |
|---|---|
| 2016 | 5.51% |
| 2017 | 14.95% |
| 2018 | 0.10% |
| 2019 | 14.76% |
| 2020 | 13.59% |
| 2021 | 15.17% |
| 2022 | (7.84%) |
| 2023 | 9.97% |
| 2024 | 10.03% |
| 2025 | 13.34% |
Annualized return since inception: 9.22%
| Q1 | Year to Date | 1 Year | 3 Years (Annualized) | 5 Years (Annualized) | |
|---|---|---|---|---|---|
| Long-Term Pool | (0.42%) | (0.42%) | 12.29% | 9.52% | 7.10% |
| Long-Term Pool Benchmark Return | (0.91%) | (0.91%) | 12.86% | 10.32% | 7.22% |
| Global Public Equity | (2.22%) | (2.22%) | 20.90% | 14.82% | 7.16% |
| Long/Short Equity | (4.36%) | (4.36%) | 6.15% | 8.28% | 2.59% |
| Fixed Income: Rates | (0.02%) | (0.02%) | 4.53% | 3.72% | 0.45% |
| Fixed Income: Credit | 0.13% | 0.13% | 6.40% | 6.85% | 3.16% |
| Diversifiers | 1.65% | 1.65% | 8.08% | 8.83% | 6.88% |
| Private Markets | 0.86% | 0.86% | 7.29% | 4.56% | 10.04% |